About the product
nCoded View
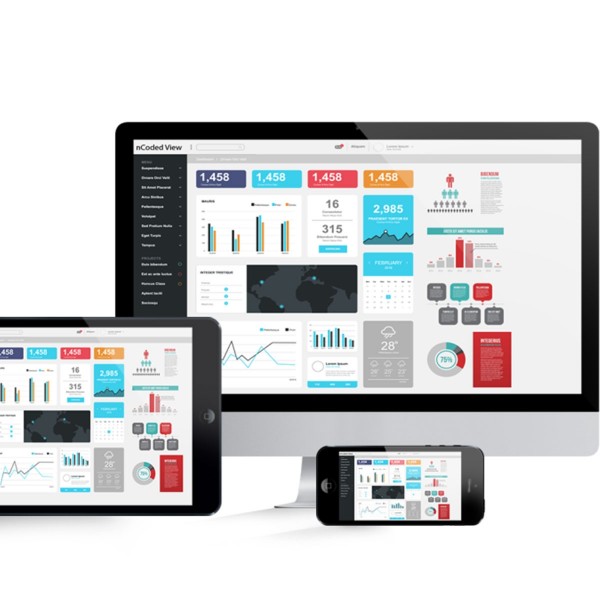
A Dashboard is an organised summary of key business metrics that really just serve to answer one key business question: ‘what is happening?’ Dashboards should ideally be interactive to make it easy for the user to find information and it should provide real-time information on performance.
nCoded Solutions has a web-based Dashboard titled ‘nCoded View’ that was developed using Microsoft ® MVC (Model View Controller) architectural logic. It was purposefully engineered with sleek web design in mind to provide an interactive experience with optimal viewing that allows for easy reading and navigation with minimal resizing, panning and scrolling, across a wide range of devices (from desktop computers to mobile phones). nCoded View was developed on the .NET Framework (version 4.5.2) that runs primarily on Windows ® and jQuery was used for a number of the client-side controls and interaction.
nCoded View allows the user to configure information such as:
Calendar details.
Resource and/or Cost Centre details.
KPI classifications such as colour specifications on the Dashboard Gauges.
Date Scale Rules (Day, Month-To-Date, Year-To-Date)
KPI Granularity (per Resource, per Department, per Business Unit, per Division, etc.)
Data source.
Number of KPIs: Our screen auto-adjusts, no matter how many KPIs are to be displayed.
Display choices.
Plus other valuable information
Contact with supplier
Company